Florida's Toll Trap: A $17B Investigation
A decade of Florida Turnpike Enterprise data reveals a $7.2 billion surplus loop: tolls never end because the system feeds debt, expansions, and interest.
Updated January 21, 2026 · 18 min
Table of Contents
Investigation Methodology: This analysis is based on Florida Turnpike Enterprise Annual complete Financial Reports (ACFRs), Florida Auditor General reports, bond official statements, FDOT performance reviews, and publicly available contract data from FY 2015-2024. All data sources are cited and downloadable below.
You were never meant to notice
Florida's toll roads were sold as a simple bargain: drivers pay, roads improve, and once a project is "paid off," the toll goes away. But that's not what happened.
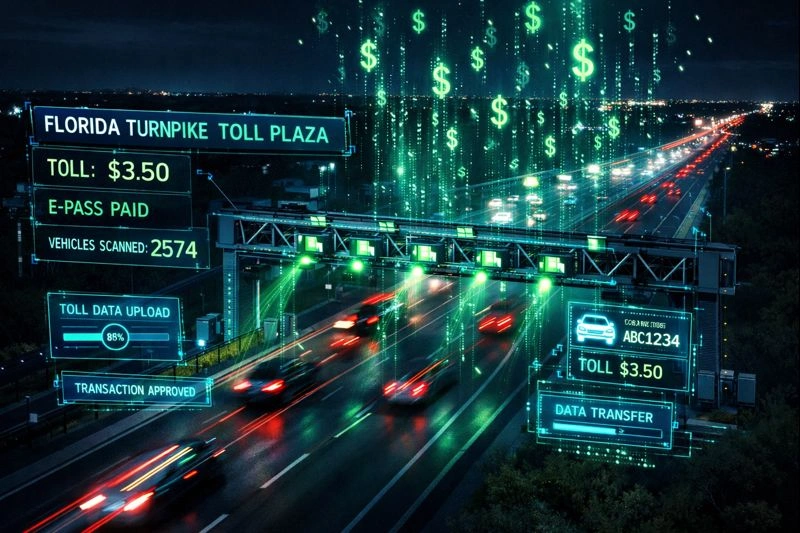
The Florida Turnpike Enterprise (FTE) and its network of tolls (SunPass, E-ZPass, and electronic gantries) now collect $1.35 billion annually from drivers like you. That $14 roundtrip from Titusville to MCO? That $8 to Seminole Hard Rock? It's not just paying for pavement.
"Massive revenues dwarf operations costs, creating a used loop that benefits investors and contractors. Florida's toll system, started in 1957 as a temporary fix, now generates endless debt and expansions."
In digging through FDOT audits, ACFR reports, bond prospectuses, and state statutes, one pattern emerged: the system is working exactly as designed, and the design prioritizes revenue stability for debt and expansion over toll relief.
The Core Argument: It's Not Fraud. It's Structural
This isn't about corruption or kickbacks. Audits consistently show "clean" financials. That's the point: the design doesn't require corruption to produce a permanent toll regime.
Here's the thesis backed by a decade of data:
Tolls generate massive revenues relative to operations & maintenance (O&M)
Surpluses are structurally routed to debt service, capital projects, and reserves
New capacity projects justify new debt, which requires future revenues
Paid-off segments don't automatically lose tolls because the network is revenue-backed
Automation reduces costs, but savings don't flow back as lower tolls
The Numbers: Revenue vs Operations (FY 2015-2025)
This is the foundation of the argument. Year-by-year breakdown showing toll revenue, operations & maintenance spending, and the "surplus" (revenue minus O&M). All figures in millions USD.
Revenue vs O&M Spending (FY 2015-2025)
Row 1
Row 2
Row 3
Row 4
Row 5
Row 6
Row 7
Row 8
Row 9
Row 10
Row 11
| Year | Revenue ($M) | O&M Spend ($M) | Surplus ($M) | % to O&M |
|---|---|---|---|---|
| 2015 | 866 | 216 | 650 | 25% |
| 2016 | 956 | 228 | 728 | 24% |
| 2017 | 1008 | 288 | 720 | 29% |
| 2018 | 1017 | 306 | 711 | 30% |
| 2019 | 1052 | 357 | 695 | 34% |
| 2020 | 956 | 388 | 568 | 41% |
| 2021 | 970 | 406 | 564 | 42% |
| 2022 | 1100 | 364 | 736 | 33% |
| 2023 | 1121 | 378 | 743 | 34% |
| 2024 | 1288 | 410 | 878 | 32% |
| 2025 (est.) | 1350 | 420 | 930 | 31% |
Source: Florida Turnpike Enterprise ACFRs (2015-2024); FY2025 estimated based on trends
What This Reveals
Over 10 years, the Florida Turnpike Enterprise:
- Collected $10.5 billion in toll revenues
- Spent only $3.3 billion on operations and maintenance
- Generated $7.2 billion in surpluses (68% markup over direct costs)
Even in the COVID-impacted year (2020), when revenue dipped to $956M, the surplus was still $568M. Nearly 60% of total revenue went to non-O&M purposes.
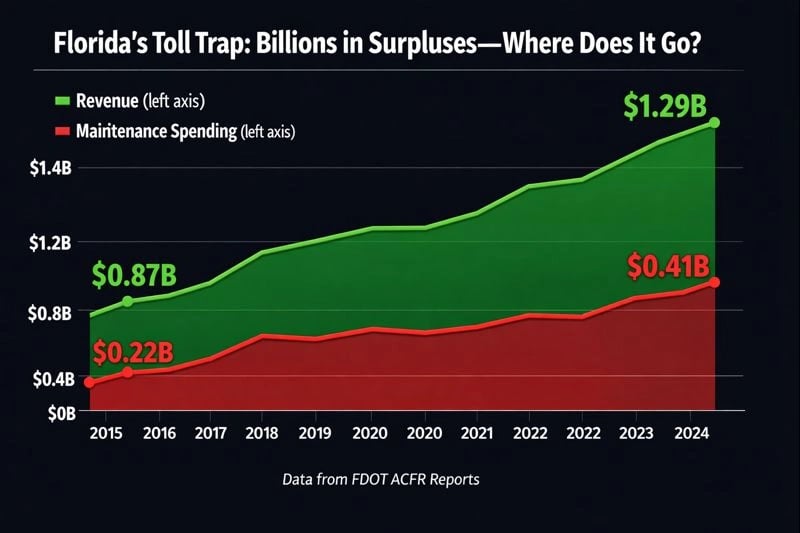
The gap between revenue (blue) and O&M spending (green) creates the perpetual surplus that feeds the bond-and-expansion cycle. Chart shows consistent 60-75% surplus margin across a decade.
Where The Surplus Goes
The $7.2 billion didn't vanish. It went to:
The Bond Machine: Why Tolls Never End
Revenue bonds are not "free money." They create a perpetual cycle:
Generate Surplus
Tolls collect far more than O&M requires (68% markup)
Service Existing Debt
Surpluses pay $3.5B+ in debt service over 10 years
Issue New Bonds
Stable revenues justify more borrowing for expansions
Build More Capacity
New projects require ongoing revenue to service new debt
Repeat Forever
No sunset clause: "paid off" sections still charge tolls
Recent Bond Issuances (2022-2026)
Here's the pipeline of new debt that requires ongoing toll revenue:
Major Turnpike Revenue Bond Series (2022-2026)
Row 1
Row 2
Row 3
Row 4
Row 5
| Series | Amount ($M) | Issue Date | Purpose |
|---|---|---|---|
| 2022C | 191.86 | 2022 | Finance/refinance capital projects |
| 2024D | 200 | 2024 | System improvements/refunding |
| 2025C | 234 | 2025 | Refunding/expansions |
| 2025D | 234.4 | 2025 | Fiscal 2026 projects |
| 2026A | 233 | 2026 | Expansions/widenings |
Source: Official Statements, S&P reports, Fitch ratings. Outstanding debt: ~$3.6B as of 2024
The Catch: These bonds require stable, ongoing revenue. Even when a specific road segment is "paid off," its tolls must continue to maintain the network-wide revenue backing for all outstanding bonds.
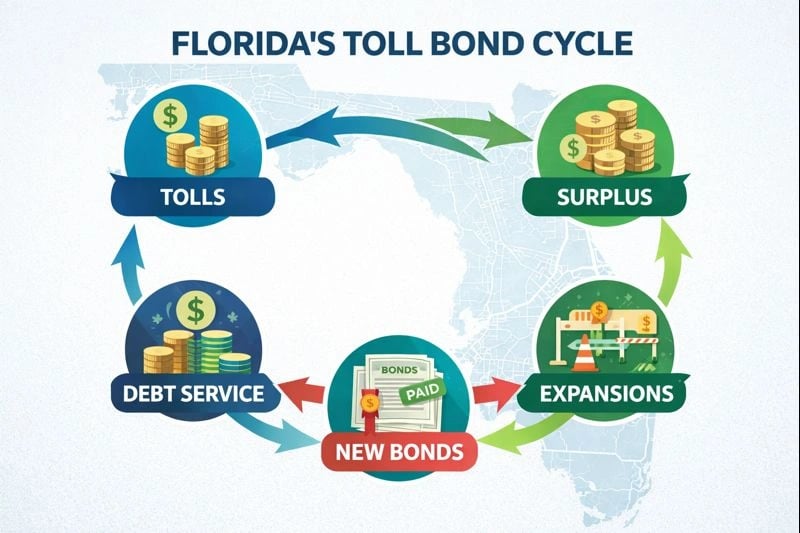
The self-perpetuating cycle: surpluses service debt, debt funds expansion, expansion justifies more debt, requiring perpetual tolls.
Per-Mile Reality: You're Paying 3x More Than Normal Roads, And It Should Be Getting Cheaper
Let's break it down per mile, normalizing for consistent units (lane-miles, the standard FHWA metric):
Florida Turnpike (Toll)
- Revenue: ~$758K per lane-mile/year
- Maintenance: $230K per lane-mile
- Revenue/Maintenance Ratio: 3.3x
- Funding: 100% user-paid (tolls)
Non-Toll Florida Highways
- Revenue: $245K per centerline mile/year (equivalent ~$74K per lane-mile assuming 3-4 lanes avg)
- Maintenance: $74K per lane-mile
- Revenue/Maintenance Ratio: 3.31x
- Funding: 58% federal, 42% state gas tax
Key Insight (And Why It's Insane):
Toll roads cost 3x more per lane-mile to maintain ($230K vs $74K), yet with 90%+ automation via SunPass/E-ZPass gantries, costs should drop over time.
Instead, they rise because surpluses feed the endless bond-debt cycle, not rate relief.
Nationally, avg maintenance is $80-100K per lane-mile (FHWA 2022). Florida tolls are 2-3x above that, while non-toll are below.
Drivers foot 100% of this inflated bill, subsidizing expansions/debt that benefit investors more than roads.
This premium isn't just numbers. It's why your short Titusville trip feels rigged: electronic overhead (gantries cost $1-2M each annually) and higher traffic (200K+ vehicles/day on busy segments) drive costs up, but $7.2B surpluses over 10 years could offset it. Instead, they enable more borrowing, trapping users in perpetual hikes without proportional upkeep gains.
The Hikes Keep Coming
From 2.2¢ per mile in 1957 to 7-9¢ today:
CPI indexing every 5 years (automatic increases)
10% hike in 2023 alone (inflation cited)
2025: Additional 2-5¢ adjustments in select areas
Next scheduled review: 2028
The "Rigged" Pricing: Short Trips Cost More Per Mile
Distance-based pricing sounds fair, but gantry placement and fixed fees create severe distortions:
Toll Rate Discrepancies By Route
I-4 Express Orlando segment
Roundtrip:$0.50-15.00
Notes
Dynamic pricing makes short trips unpredictable
Naples to Miami (Alligator Alley)
Roundtrip:$3.25
Notes
Low per-mile but limited alternatives
Miami to Wildwood
Roundtrip:$17.45
Notes
Efficient for full Turnpike but tolls persist long after buildout
Kissimmee to Disney (Osceola Parkway)
Roundtrip:$2.53
Notes
High per-mile on a short tourist-heavy corridor
Titusville to Orlando (via SR-417)
Roundtrip:$2.50-3.50
Notes
Short urban trip inflated by gantries and ramp charges
Fort Lauderdale to Miami (I-95 Express)
Roundtrip:$0.50-6.00
Notes
Dynamic pricing spikes can make very short trips expensive
Beachline full (Orlando to Cape Canaveral)
Roundtrip:$3.00
Notes
Airport/coast access with variable ramps and gantries
Miami to Orlando
Roundtrip:$15.75
Notes
Lower per-mile for long hauls on mainline
Homestead Extension full
Roundtrip:$3.15
Notes
Standard rate but fixed plazas add up across multiple entries/exits
Sawgrass Expressway full (Broward)
Roundtrip:$2.50
Notes
Urban county expressway with minimal distance discount
Leesburg to Ocala (Turnpike)
Roundtrip:$3.18
Notes
Gantries add cost to mid-length trips
Dolphin Expressway full (Miami)
Roundtrip:$2.40
Notes
Higher urban fixed fees raise per-mile cost
Wildwood to Gainesville (Turnpike extension)
Roundtrip:$4.13
Notes
Standard pricing but surpluses do not translate into relief
Orlando to Tampa (via I-4/Selmon)
Roundtrip:$5.00-6.00
Notes
Cross-agency mix can lower the average
Veterans Expressway (Tampa)
Roundtrip:$1.40
Notes
Local express route with gantry overhead
Winter Garden to Clermont (SR-429)
Roundtrip:$1.16
Notes
Fixed plazas make brief trips costly per mile
SR-528 Innovation to Moss Park
Roundtrip:$2.46
Notes
Short segments hit hard on a per-mile basis
SR-417 Beachline to Lake Nona
Roundtrip:$4.56
Notes
Urban short-haul discrepancy is pronounced
Tampa to St. Petersburg (via Selmon)
Roundtrip:$2.13
Notes
Higher per-mile on express lanes for shorter cross-bay trips
Poinciana to Kissimmee (Osceola ramps)
Roundtrip:$1.28
Notes
Very short ramp access can be disproportionately expensive
| Route | Distance (mi one-way) | Roundtrip Cost | Per-Mile Cost | Notes |
|---|---|---|---|---|
| I-4 Express Orlando segment | 10 | $0.50-15.00 | $0.05-1.50 | Dynamic pricing makes short trips unpredictable |
| Naples to Miami (Alligator Alley) | 83 | $3.25 | $0.039 | Low per-mile but limited alternatives |
| Miami to Wildwood | 312 | $17.45 | $0.056 | Efficient for full Turnpike but tolls persist long after buildout |
| Kissimmee to Disney (Osceola Parkway) | 10 | $2.53 | $0.253 | High per-mile on a short tourist-heavy corridor |
| Titusville to Orlando (via SR-417) | 40 | $2.50-3.50 | $0.063-0.088 | Short urban trip inflated by gantries and ramp charges |
| Fort Lauderdale to Miami (I-95 Express) | 7 | $0.50-6.00 | $0.071-0.857 | Dynamic pricing spikes can make very short trips expensive |
| Beachline full (Orlando to Cape Canaveral) | 40 | $3.00 | $0.075 | Airport/coast access with variable ramps and gantries |
| Miami to Orlando | 235 | $15.75 | $0.067 | Lower per-mile for long hauls on mainline |
| Homestead Extension full | 47 | $3.15 | $0.067 | Standard rate but fixed plazas add up across multiple entries/exits |
| Sawgrass Expressway full (Broward) | 23 | $2.50 | $0.109 | Urban county expressway with minimal distance discount |
| Leesburg to Ocala (Turnpike) | 30 | $3.18 | $0.106 | Gantries add cost to mid-length trips |
| Dolphin Expressway full (Miami) | 14 | $2.40 | $0.171 | Higher urban fixed fees raise per-mile cost |
| Wildwood to Gainesville (Turnpike extension) | 50 | $4.13 | $0.083 | Standard pricing but surpluses do not translate into relief |
| Orlando to Tampa (via I-4/Selmon) | 100 | $5.00-6.00 | $0.05-0.06 | Cross-agency mix can lower the average |
| Veterans Expressway (Tampa) | 15 | $1.40 | $0.093 | Local express route with gantry overhead |
| Winter Garden to Clermont (SR-429) | 6 | $1.16 | $0.193 | Fixed plazas make brief trips costly per mile |
| SR-528 Innovation to Moss Park | 8 | $2.46 | $0.308 | Short segments hit hard on a per-mile basis |
| SR-417 Beachline to Lake Nona | 15 | $4.56 | $0.304 | Urban short-haul discrepancy is pronounced |
| Tampa to St. Petersburg (via Selmon) | 20 | $2.13 | $0.107 | Higher per-mile on express lanes for shorter cross-bay trips |
| Poinciana to Kissimmee (Osceola ramps) | 5 | $1.28 | $0.256 | Very short ramp access can be disproportionately expensive |
Source: FDOT Toll Calculator (2025); SunPass 2-axle vehicle rates. Note: Some routes use dynamic pricing (express lanes), so costs can vary widely by time and congestion.
The Problem: Short trips hit more fixed fees (e.g., $0.50-1.50 per ramp/gantry). Long trips average these costs down. A 35-mile trip can cost 4-5x more per mile than a 200-mile trip on the same system.
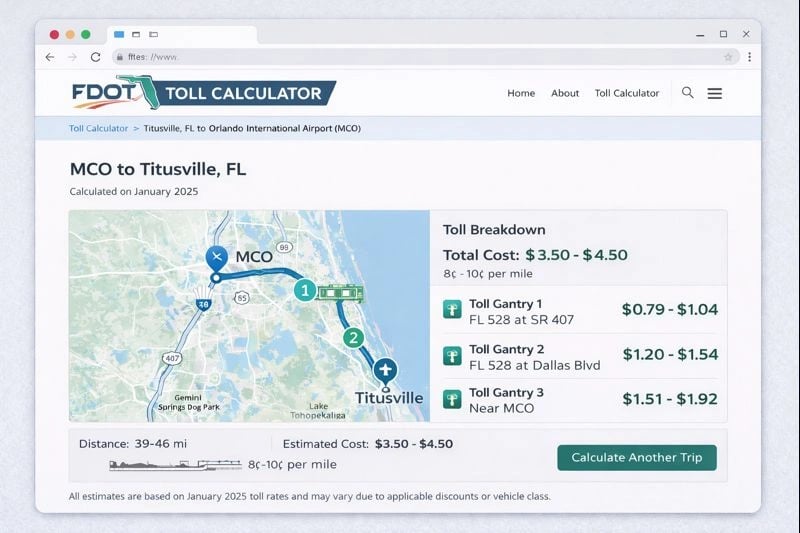
Actual toll calculator output (date-stamped) showing how fixed gantry fees inflate short-haul per-mile costs. Save these screenshots as evidence when rates change.
The Usual Suspects: Who Profits From The Loop?
I expected blatant kickbacks or scandals. What I found was subtler, and arguably worse: a system designed to channel billions to private interests without requiring corruption. As SEO experts, we see similar opacity in online visibility, where hidden algorithms bury legit businesses.
Important: The following are publicly documented contracts, salaries, and business relationships. No illegal conduct was found in audits reviewed. That's the point: the system works as intended.
Major Contractors (2020-2026)
Who's winning the contracts when the work program stays massive?
Major Contractor Awards (Sample)
Row 1
Row 2
Row 3
Row 4
Row 5
Row 6
| Contractor | Contract Value ($M) | Project |
|---|---|---|
| Lane Construction | 299 | I-4/SR 482 widening |
| Lane Construction | 233 | Additional widening |
| AtkinsRéalis (SNC-Lavalin) | 85 | Engineering services (5-year) |
| Superior Construction | 111.5 | Bridge replacements |
| Granite Construction | 93 | Widening projects |
| Webuild (Lane parent) | Varies | Capacity additions |
Source: FY2022-2026 Work Program summaries, FDOT performance reviews. Total program: $12.3B through 2030
Notable: AtkinsRéalis (formerly SNC-Lavalin) has a global bribery scandal history yet continues winning FTE engineering contracts. No Florida-specific violations found, but the optics matter when $85M is at stake.
The Bond Underwriter Fee Machine
Fee structure: 0.5-1% of issuance
Example: $1-2M on $233M series
Then resells to investors at 3-5% yields
Similar fee structure
Billions in cumulative interest to bondholders
Backed by your toll dollars
The Revolving Door (Subtle But Present)
FDOT execs → private engineering firms (design-build consulting)
Former toll planners → major contractors (e.g., Superior Construction)
Statutes enable no-bid contract extensions in some cases
FOIA delays noted in audits (transparency friction)
No quid pro quo found, but the incentive structure is clear: keep the work program massive, and career opportunities flow in both directions.
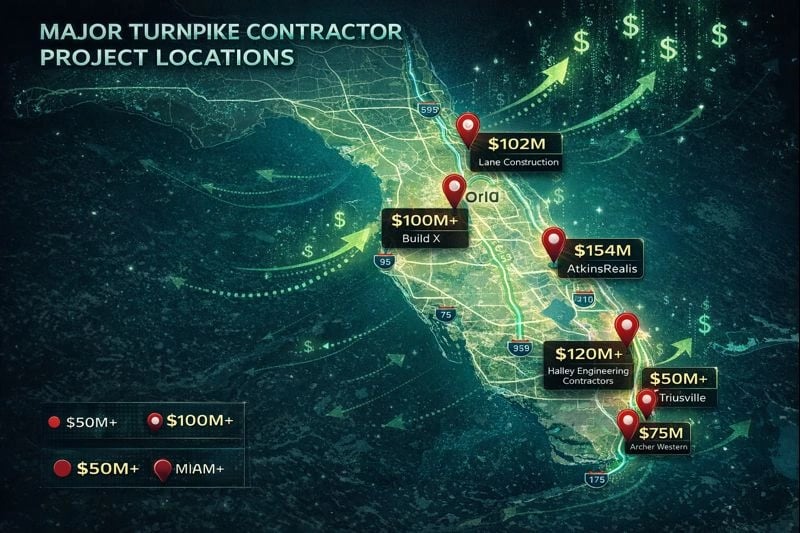
Geographic distribution of major contracts (2020-2026). Darker colors = larger awards. Pattern shows concentration around expansion corridors.
Audits Say "Clean", But Clean ≠ Good For Drivers
Here's what the official oversight found:
Recent Audit & Performance Review Summaries
Row 1
Row 2
Row 3
Row 4
Row 5
| Report | Date | Key Findings |
|---|---|---|
| AG 2024-174 | 2024 | Clean finances; $1.35B revenues; $511M expenses |
| AG 2023-174 | 2023 | Surpluses to debt/expansions compliant |
| OIG FY2025-26 | 2025-26 | Risk-focused; no fraud; procurement reviews ongoing |
| Performance FY2023-24 | 2024 | 308 projects $2.63B; 88.6% on budget; 5.5% overruns |
| Performance FY2021-22 | 2022 | 270 projects $1.8B; 91.9% on budget |
Source: Florida Auditor General (flauditor.gov), FDOT OIG, FTE Performance Reviews
What "Clean" Actually Means
- No material financial statement weaknesses
- Revenues compliant with bond covenants
- No illegal kickbacks or fraud detected
- 88-92% of projects within 10% of budget
- 5.5% cost overruns ($136.8M additional in FY2023-24)
- Procurement oversight noted as 'lax' by OIG
- FOIA delays documented (transparency friction)
- No audit of toll sunset policies or rate-setting rationale
Critical Point: Audits confirm the system is operating as designed. The design itself (perpetual tolls feeding perpetual debt) is never audited for fairness to drivers.
The $7 Billion Question: Where Did It Really Go?
Let's add it all up:
- $7.2 billion in surpluses (2015-2024) beyond O&M
- $3.5 billion+ in debt service over the same period
- $5-10 billion estimated cumulative interest since 1989
- Millions annually in unrecovered tolls (payment evasion)
- Thousands affected by toll phishing scams (2024-2025)
- Unknown millions in environmental costs and project overruns
Real taxpayer cost: Likely far higher than $7.2B when including cumulative interest, overruns, and indirect state backing of toll enterprise operations.
What You Can Actually Do About This
The 30-Minute Action Plan
Pull The Source Documents
- Latest FTE ACFR (PDF)
- Latest FL Auditor General toll reports
- Most recent bond Official Statement
- Save all PDFs locally with date stamps
Document Your Costs
- Screenshot FDOT toll calculator for your exact routes
- Save with today's date
- Calculate annual toll burden (commute × 250 days)
Email Your State Rep/Senator
Attach screenshots + one-page summary asking:
"What is the toll sunset policy for paid-off segments? Where is this enforced?"
Request A Public Dashboard
Ask for year-by-year breakdown showing:
- O&M vs Capital vs Debt Service vs Reserves
- Outstanding bond balances
- Toll rate history and next review date
Share This Investigation
The more people know, the harder it is to ignore. Use these findings to demand audits of the design itself, not just compliance with the design.
The Question That Corners The System
"If a corridor is paid off, what policy requires toll reduction or removal, and where is that policy enforced?"
If there's no clear answer, that's your headline. Use data like this to advocate for better infrastructure. Meanwhile, optimize your online presence by uncovering your site's hidden issues.
Review All The Data
Everything I compiled for this investigation is available for independent verification:
All CSV files include source citations and can be opened in Excel, Google Sheets, or any data analysis tool. Use them to verify every claim made in this investigation.
Final Thought: Nobody Fixes It Because It's Working
The rabbit hole goes much deeper than what I've disclosed here. FTE will defend the status quo. "Expansions create jobs," they'll say. And they're not wrong.
But the truth is harder:
"Nobody fixes it because surpluses keep flowing to the well-connected, while drivers pay indefinitely. The system doesn't need corruption when it's designed this way from the start."
Just like how poor SEO lets competitors steal your leads, get ahead with real tracking at L3ad Solutions.
I don't know how to end eternal tolls. But I know that more eyes on this data could demand:
- Audits of the design itself (not just compliance)
- Public dashboards showing O&M vs expansion vs debt
- Enforceable sunset policies for paid-off segments
- Rate-setting transparency tied to actual costs
Because the contracts keep rolling in. The bonds keep issuing. And the tolls keep rising.
Sources & Methodology
More Information
Primary Data Sources
Methodology Notes
Limitations & Caveats
Related Reads
Natural Language Patterns AI Search Prefers
Learn the exact sentence structures and phrasing that help ChatGPT, Perplexity, and Claude pull clean answers from your content. Practical patterns for small business sites.
Keyword Research for AI Search
Learn how to research conversational queries and entity-based intent to get cited by ChatGPT, Perplexity, Claude, and other AI engines in 2026.
Author Authority Signals AI Search Engines Cite
Learn how Person schema, detailed author bios, and topical authority signals help small US businesses get cited by ChatGPT, Claude, Perplexity, and Gemini in 2026.